Sarah Franciosa
Data analytics strengthens business by encouraging disciplined thinking, keeping key decision-makers focused, improving processes and optimizing communication between business leaders and data experts in order to drive the right conversations for the success of the business. (CareersInAnalytics.com,2020). When visuals are applied to data, they can enlighten the audience to insights that they would not see without charts or graphs. Many interesting patterns and outliers in the data would remain hidden in the rows and columns of data tables without the help of data visualizations. (Soomo,2020).
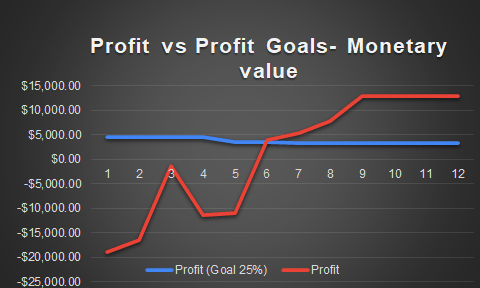
Cost of goods sold was high the first four months ($23,920) but soon started decreasing as labor/materials and overhead costs went down. As units sold increased, so did revenue; and with the cost of goods sold getting lower, our profits have grown substantially since the product was launched.
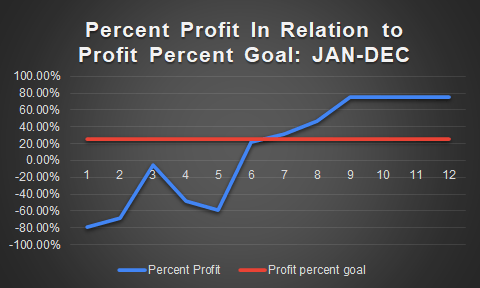
From the data, we can see that the sales increased significantly in March, but then took a dip in April and May. Profit and revenue steadily increased, and we hit a profit in June and accomplished out profit percent goal by July.
Line graphs are helpful when analyzing trends. I wanted to see how the data set performed during a specific time period (Jan-Dec) so that it is easy to visualize the performance of the product. I also used a chart to compare the value sets- profit vs COGS in dollar amount. This allows the audience to see the highs and lows in the set of data over the time frame. The purpose of the visualizations is to represent profits in relation to the COGS from the launch of the product in January through the end of the year. It shows how profit has increased, surpassing out initial profit percent goal of 25% to 75.5% by the end of the year.
The target audience and purpose here is to communicate with other leaders on the team. I feel as though these data visualizations show progression and can motivate and inspire confidence within the organization to continue to meet and surpass our set goals together.
CareersInAnalytics.com. (May 4, 2020). The Importance Of Data Analytics In An Organization. Retrieved January 29, 2021 from https://www.isaca.org/membership/membership-benefits/benefits-partner-content/career-guidance-articles/the-importance-of-data-analytics-in-an-organisation
| Jan | Feb | Mar | Apr | May | Jun | Jul | Aug | Sep | Oct | Nov | Dec | Annual Numbers | |
| Labor | 8,400.00 | 8,400.00 | 8,400.00 | 8,400.00 | 4,200.00 | 4,200.00 | 3,150.00 | 3,150.00 | 3,150.00 | 3,150.00 | 3,150.00 | 3,150.00 | |
| Materials | $10,000.00 | $10,000.00 | $10,000.00 | $10,000.00 | $10,000.00 | $10,000.00 | $10,000.00 | $10,000.00 | $10,000.00 | $10,000.00 | $10,000.00 | $10,000.00 | |
| Overhead (30%) | $5,520.00 | $5,520.00 | $5,520.00 | $5,520.00 | $4,260.00 | $4,260.00 | $3,945.00 | $3,945.00 | $3,945.00 | $3,945.00 | $3,945.00 | $3,945.00 | |
| Profit (Goal 25%) | $4,600.00 | $4,600.00 | $4,600.00 | $4,600.00 | $3,550.00 | $3,550.00 | $3,287.50 | $3,287.50 | $3,287.50 | $3,287.50 | $3,287.50 | $3,287.50 | |
| Number of Units Produced | 100,000.00 | 100,000.00 | 100,000.00 | 100,000.00 | 100,000.00 | 100,000.00 | 100,000.00 | 100,000.00 | 100,000.00 | 100,000.00 | 100,000.00 | 100,000.00 | |
| Sold Units | 20,000.00 | 30,000.00 | 90,000.00 | 50,000.00 | 30,000.00 | 90,000.00 | 90,000.00 | 100,000.00 | 120,000.00 | 120,000.00 | 120,000.00 | 120,000.00 | |
| Unit Price | $0.25 | $0.25 | $0.25 | $0.25 | $0.25 | $0.25 | $0.25 | $0.25 | $0.25 | $0.25 | $0.25 | $0.25 | |
| Total Revenue | $5,000.00 | $7,500.00 | $22,500.00 | $12,500.00 | $7,500.00 | $22,500.00 | $22,500.00 | $25,000.00 | $30,000.00 | $30,000.00 | $30,000.00 | $30,000.00 | |
| Labor and Materials | 18,400.00 | 18,400.00 | 18,400.00 | 18,400.00 | 14,200.00 | 14,200.00 | 13,150.00 | 13,150.00 | 13,150.00 | 13,150.00 | 13,150.00 | 13,150.00 | |
| Profit Goal | $4,600.00 | $4,600.00 | $4,600.00 | $4,600.00 | $3,550.00 | $3,550.00 | $3,287.50 | $3,287.50 | $3,287.50 | $3,287.50 | $3,287.50 | $3,287.50 | |
| Overhead | $5,520.00 | $5,520.00 | $5,520.00 | $5,520.00 | $4,260.00 | $4,260.00 | $3,945.00 | $3,945.00 | $3,945.00 | $3,945.00 | $3,945.00 | $3,945.00 | |
| Target Revenue | 28,520.00 | 28,520.00 | 28,520.00 | 28,520.00 | 22,010.00 | 22,010.00 | 20,382.50 | 20,382.50 | 20,382.50 | 20,382.50 | 20,382.50 | 20,382.50 | |
| -23,520.00 | -21,020.00 | -6,020.00 | -16,020.00 | -14,510.00 | $490.00 | 2,117.50 | 4,617.50 | 9,617.50 | 9,617.50 | 9,617.50 | 9,617.50 | ||
| Cost of Goods | 23,920.00 | 23,920.00 | 23,920.00 | 23,920.00 | 18,460.00 | 18,460.00 | 17,095.00 | 17,095.00 | 17,095.00 | 17,095.00 | 17,095.00 | 17,095.00 | 235,170.00 |
| Total Revenue | $5,000.00 | $7,500.00 | $22,500.00 | $12,500.00 | $7,500.00 | $22,500.00 | $22,500.00 | $25,000.00 | $30,000.00 | $30,000.00 | $30,000.00 | $30,000.00 | $245,000.00 |
| Profit | -18,920.00 | -16,420.00 | -1,420.00 | -11,420.00 | -10,960.00 | 4,040.00 | 5,405.00 | 7,905.00 | 12,905.00 | 12,905.00 | 12,905.00 | 12,905.00 | 9,830.00 |
| Percent Profit | -79.10% | -68.65% | -5.94% | -47.74% | -59.37% | 21.89% | 31.62% | 46.24% | 75.49% | 75.49% | 75.49% | 75.49% | 4.18% |
| Profit percent goal | 25% | 25% | 25% | 25% | 25% | 25% | 25% | 25% | 25% | 25% | 25% | 25% | 4.18% |